 YAP
Charts5 min read · YAP team
Support and resistance: the basics for crypto traders
What support and resistance are, how to find them on a chart, and how traders use them.
Key points
- Support is where buyers stepped in before.
- Resistance is where sellers took over.
- Levels break more often on new coins.
What they are
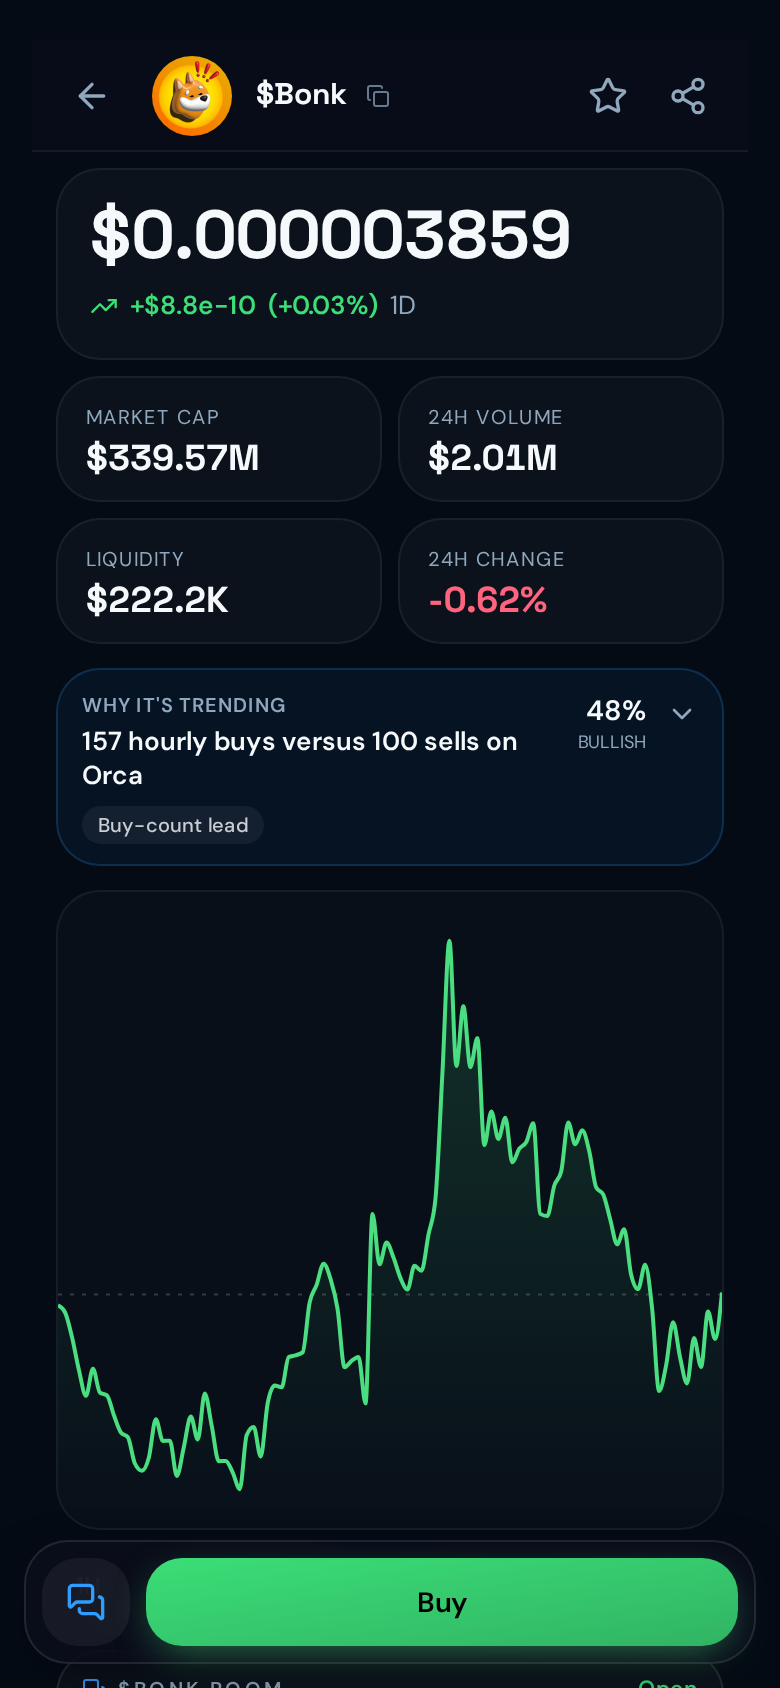
Support is a price where a coin stopped falling before because buyers stepped in. Resistance is a price where it stopped rising because sellers took profit.
Finding them
Look for prices the chart touched two or more times and turned back from. Round market caps like $100K or $1M often act as levels too.
Using them
Traders often buy near support with a small stop below it, and sell some near resistance. When a level breaks with high volume, it often flips: old resistance becomes new support.
A warning
On new meme coins, levels are weak. A few large wallets can push straight through them, so keep size small.
Try it on YAP
Start trading